Rendering Images
In many cases, the point of working with rasters is rendering images which facilitate quick interpretation and use by human analysts. This process of rendering imagery from rasters is a question of mapping the contents from each cell of data to a color which represents those contents. To this end, ColorMap, ColorRamp, and some RGB-handling conveniences are provided in the geotrellis.raster.render package and discussed (with examples) below.
The tools provided by GeoTrellis core are relatively low level and will be the focus of what follows. We'll be looking at how to specify desired colors for avoiding most discussion about which colors are desirable/sensible.
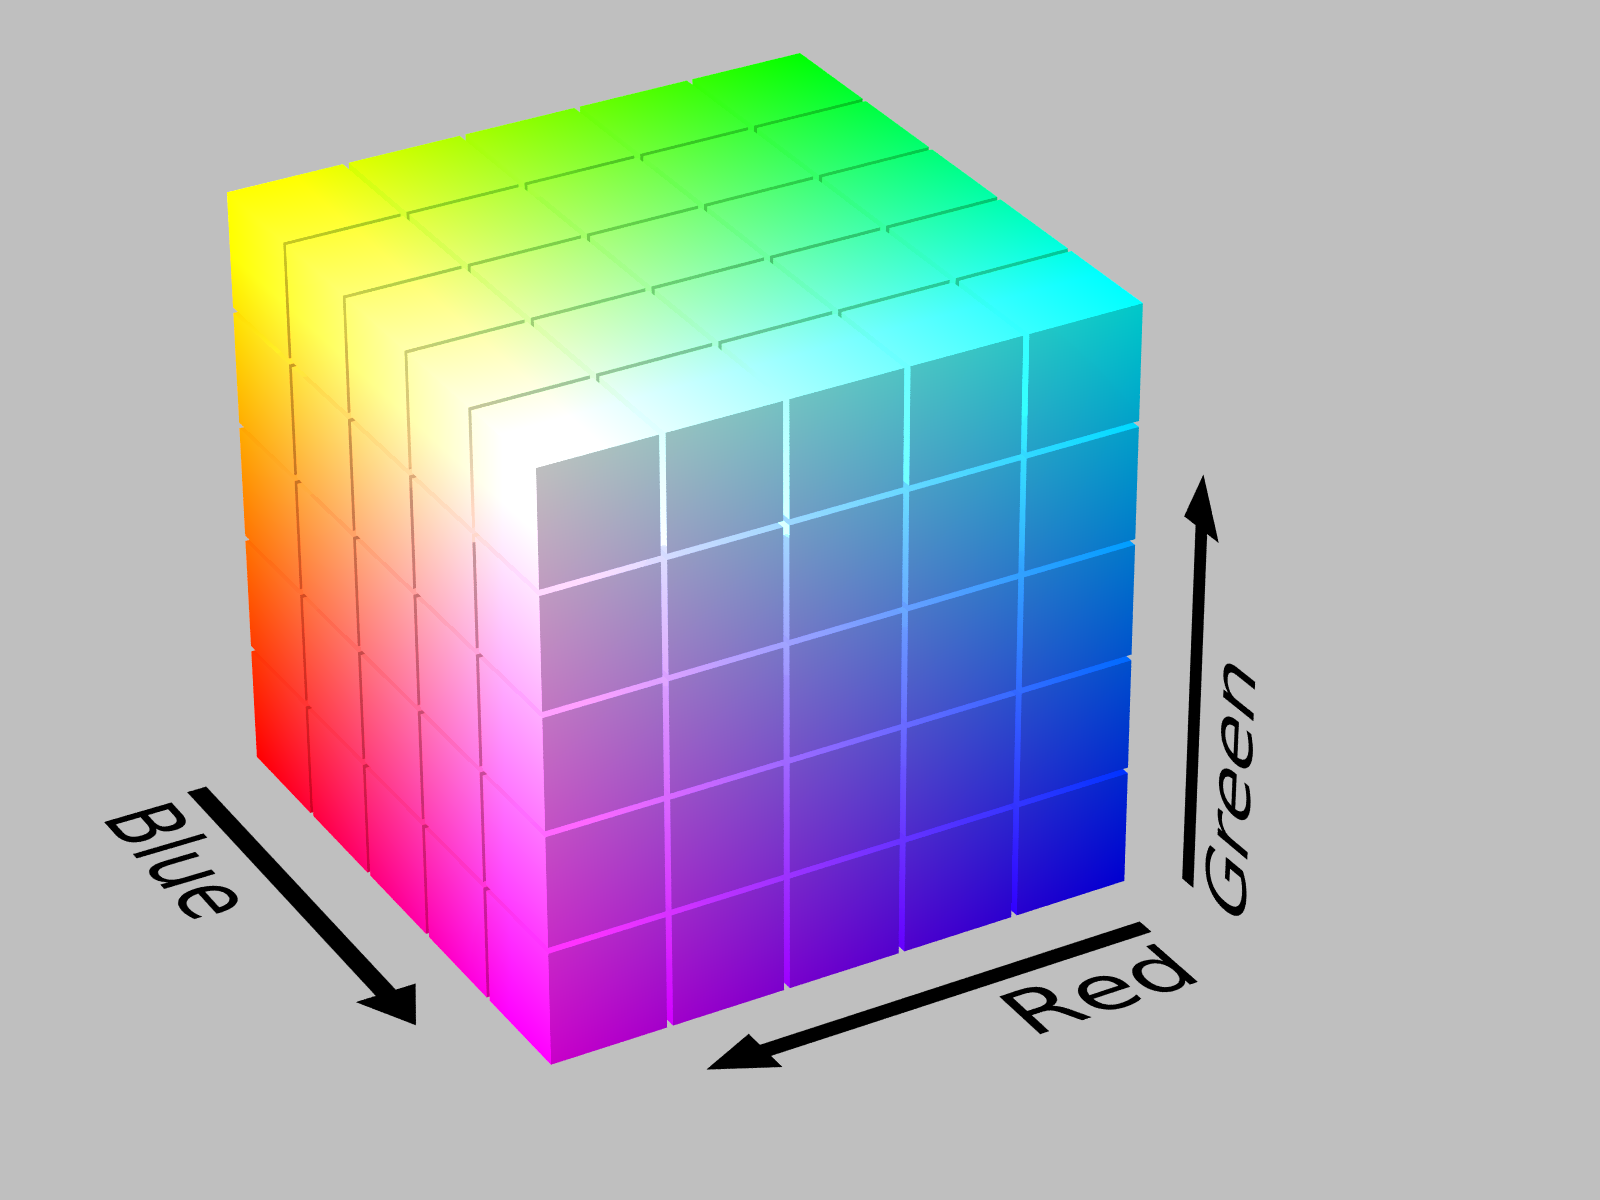
Representing RGB values
RGB values exist in a very simple cubic 'color-space'. A three-dimensional space, referencing any point (which is a color) can be done with three numbers. Those numbers represent R, G, and B values the combination of which results in a full-fledged RGB color. This way of referring to colors is even familiar to non-technical people who often don't even realize it because of its widespread adoption for internet standards.
Let's take a look at the color red. Here's its representation in the hexadecimal notation that people are often familiar with: #FF0000. If be break this number apart into groups of two decimal places, the components are easier to see:
R: FF = 255
G: 00 = 0
B: 00 = 0
0xFF0000 // another way to say #FF0000
// res0: Int = 16711680

Because 0 to 255 is the size of a byte and because integers are 4 bytes, integers are another way of naming RGB colors + an alpha channel value. Integers are a bit more difficult to read as colors than their hex-formatted alternative so GeoTrellis introduces a few conveniences. You can explicitly and separately specify R, G, B, and A or else directly use a hex code in the 0x format rather than the more familiar # format
import geotrellis.raster.render.RGBA
RGBA(255, 0, 0, 0) == RGBA(0xFF000000).int
// res1: Boolean = true
RGBA(255, 0, 0, 0).red == RGBA(0xFF000000).red
// res2: Boolean = true
RGBA(255, 0, 0, 0).green == RGBA(0xFF000000).green
// res3: Boolean = true
RGBA(255, 0, 0, 0).blue == RGBA(0xFF000000).blue
// res4: Boolean = true
RGBA(255, 0, 0, 0).alpha == RGBA(0xFF000000).alpha
// res5: Boolean = true
An Example Tile
Before we look at the rendering options, it would be helpful to create a simple, predictable tile to render. We'll use this tile to illustrate the rendering API. This tile will range from 1 to 100 with 1 in the top left and 100 in the bottom right.
GeoTrellis tiles are indexed in a row-major order such that the first row contains values 1 through 10; the second, 11 through 20; the third, 21 through 30; etc
import geotrellis.raster._
val tile = ArrayTile(1 to 100 toArray, 10, 10)
ColorMap
A ColorMap defines
- a set of associations between break points (which are expected cell values) and colors (integers representing RGB color values)
- the necessary set of options for determining on which side of the break its associated color should be applied. (Is the color applied to values greater than, less than, or equal to the provided break?)
This ColorMap will render only values 42 (as red) and 99 (as green):
import geotrellis.raster.render.Exact
val red = RGBA(255, 0, 0, 255)
// red: Int = -16776961
val green = RGBA(0, 255, 0, 255)
// green: Int = 16711935
val options = ColorMap.Options.DEFAULT.copy(classBoundaryType=Exact)
// options: ColorMap.Options = Options(Exact, 0, 0, false)
val colorMap = ColorMap(Map(42 -> red, 99 -> green), options)
// colorMap: ColorMap = geotrellis.raster.render.IntColorMap@5cfaf132
Using this ColorMap to render a PNG or JPG is easy:
tile.renderPng(colorMap)
tile.renderJpg(colorMap)
ColorRamp
A ColorRamp specifies only a set of colors.
val colorRamp = ColorRamp(0xFF0000, 0x00FF00, 0x0000FF)
// colorRamp: render.ColorRamp = geotrellis.raster.render.ColorRamp@3135ec58
Generating a ColorMap
Rendering with a ColorRamp requires first turning it into a ColorMap so that those colors are associated with cell values. Despite the extra step, they tend to be easier to work with than ColorMaps because this delayed pairing provides some flexibility. A ColorRamp has two main ways of producing a ColorMap. First, it can use a Tile's Histogram. Second, breaks can be provided manually.
Via Histogram
A histogram for a given distribution allows us to determine where in that distribution a new value would fall. They also allow us to approximate the value which would fall at arbitrary percentiles. This can be used to generate breaks which favor areas of greater density within your data's distribution.
val histogram = tile.histogram
// histogram: Histogram[Int] = geotrellis.raster.histogram.FastMapHistogram@7f62da01
val generatedCMap = colorRamp.toColorMap(histogram)
// generatedCMap: ColorMap = geotrellis.raster.render.IntColorMap@4ef539de
The Histogram-based toColorMap method will only generate as many breaks as there are colors in your ramp. Given a ColorRamp of 3 colors and a tile ranging from 1 to 100 (this makes the math simple) we should expect to see a ColorMap with breaks of 33, 67, and 100.
Take care that your
ColorRamphas enough colors in it when using theHistogram-basedtoColorMapmethod!
generatedCMap.breaksString
// res8: String = "33:ff0000;67:ff00;100:ff"
If more breaks are required, first take advantage of ColorRamps ability to generate a larger ColorRamp through interpolation and then generate your ColorMap:
val largeColorRamp = colorRamp.stops(10)
// largeColorRamp: render.ColorRamp = geotrellis.raster.render.ColorRamp@458d3253
val largeGeneratedCMap = largeColorRamp.toColorMap(histogram)
// largeGeneratedCMap: ColorMap = geotrellis.raster.render.IntColorMap@5bc45196
largeGeneratedCMap.breaksString
// res9: String = "10:ff0000;20:c73800;60:e31c;70:aa55;80:728d;50:1de200;40:55aa00;30:8e7100;90:39c6;100:ff"
Via Breaks
If certain values are meaningful and well known ahead of analyzing data, they can be used along with ColorRamp to generate a ColorMap with as many colors as provided breaks.
val ndviColors = ColorRamp(0xFF0000, 0xFFFF00, 0x00FF00)
// ndviColors: render.ColorRamp = geotrellis.raster.render.ColorRamp@329f2a3d
val ndviValues = Array(-1, -0.5, 0, 0.5, 1)
// ndviValues: Array[Double] = Array(-1.0, -0.5, 0.0, 0.5, 1.0)
ndviColors.toColorMap(ndviValues).breaksString
// res10: String = "0.0:ffff00;1.0:ff00;-0.5:ff7f00;0.5:80ff00;-1.0:ff0000"
Exporting Rendered Imagery
Rendered images can be conveniently written to disk or serialized as an array of bytes to be stored or exported.
Writing to disk:
tile.renderJpg(colorMap).write("/tmp/rendered.jpg")
Serializing to an array of bytes:
tile.renderJpg(colorMap).bytes